Health Checks

Canary Checker defines and runs periodic health checks against services, infrastructure, and applications.
- Synthetic checks test services and applications by generating requests using HTTP, SQL, MongoDB, Redis, LDAP, and other protocols.
- Passive checks consolidate alerts from monitoring systems like Prometheus, Datadog, Dynatrace, CloudWatch, and Elasticsearch.
- Infrastructure checks verify Kubernetes resources, object storage, databases, and cloud APIs.
- Integration checks run automated test suites using tools like Playwright, JUnit, Newman, and k6 to validate end-to-end functionality across services and infrastructure.
Under the hood health checks are implemented using the open-source flanksource/canary-checker project
Metrics Exporter
In addition to returning a pass/fail status, health checks can export metrics to Prometheus, replacing the need for many custom Prometheus exporters.
Scripting
Evaluate the health of checks using scripts in CEL, JavaScript, or Go templates. Scripts can also filter and transform alerts from external systems.
Dashboard
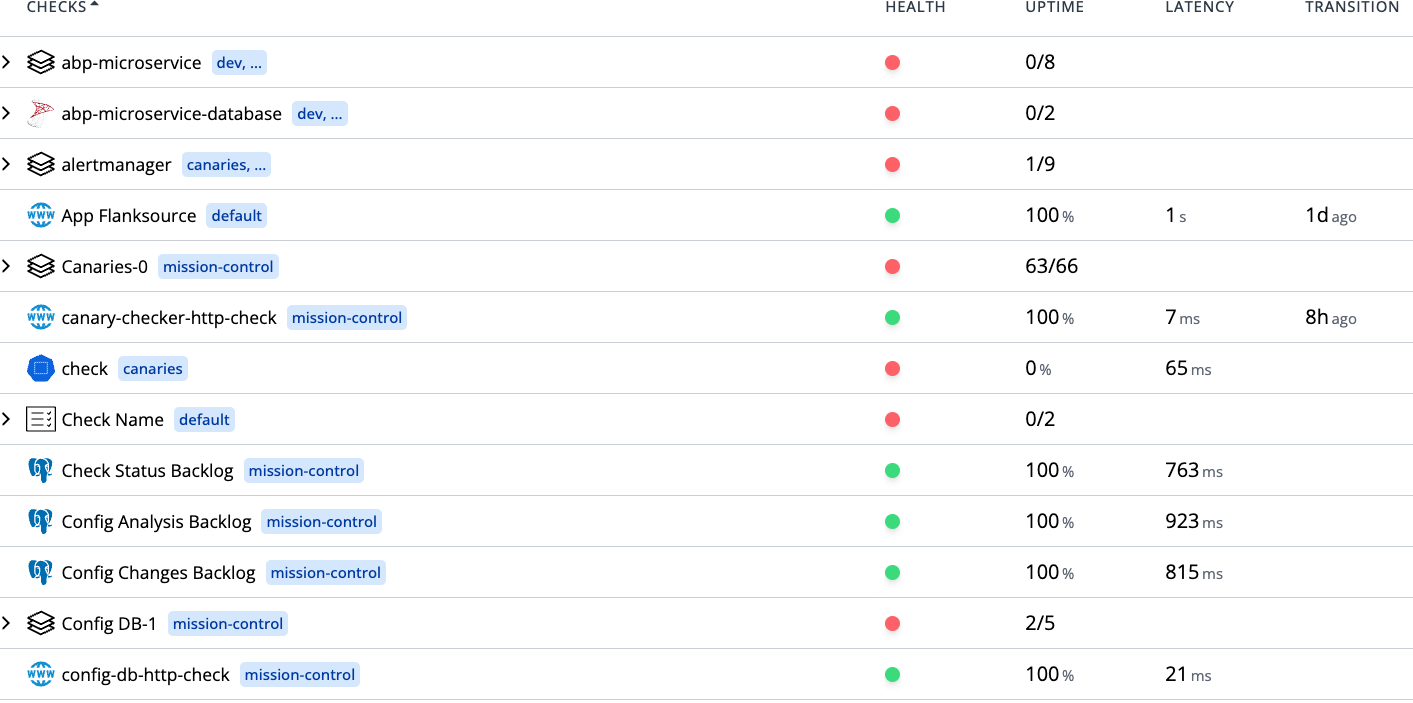
The health checks page provides a high-level view of the overall health of all services, infrastructure, and applications. It surfaces recent failures and provides high-level latency and reliability metrics.
Prometheus
Prometheus metrics are exposed from health checks to provide high-level visibility into latency, error rates, and other metrics. This lets you monitor the health of services and applications using existing Prometheus alerts and Grafana dashboards.
Synthetic
Synthetic checks test services and applications by generating requests using HTTP, SQL, MongoDB, Redis, LDAP, and other protocols.